On December 18, the new Sip Club, hosted by Expandable Software, MIE Solutions and the Mirador Software Group, was pleased to host over fifty professionals for a Holiday Show and Tell session. Although we typically have one topic expert leading the discussion, December’s Sip Club was a bit different. Instead of a presentation or panel, we invited a few Users to show off one of their favorite reports, dashboards, or KPIs, that help them better understand their business or make key decisions and keep their operations running smoothly.
The Sip Club welcomed Clay Tallon, Engineering Manager from Qualex Manufacturing, Sean Duffy, Supply Chain Supervisor from Cardinal Health, Jonathan Nordquist, General Manager of Horizon Manufacturing & Repair, Michael David, President of David Engineering and a special guest appearance by Bill Haynes, General Manager for North America for Mirador Software Group
The indicators and dashboards shared were proprietary and Company-specific, and included specifics related to production scheduling, order status, detailed business forecasting and Customer Engagement data. While reviewing these metrics, several common themes emerged.
What are Users doing to support their businesses with Key Performance Indicators (KPI’s) and Dashboards?
Standard Metrics vs. Custom Metrics
Although many if not most ERP systems now have imbedded Dashboard capabilities, it is important to focus on the few key metrics that drive the business as opposed to the many “standard” metrics that systems “know” and can readily generate. In some cases, a key indicator may have to be derived using multiple data elements captured in the ERP.
In the case of MIE Solutions, MIE Trak Pro offers many features to help management teams stay ahead of production needs. One of the most popular options comes in the form of Quick Views. These powerful and highly customizable reports can provide greater insight into important business and production metrics and can be tailored to suit your team’s specific needs.
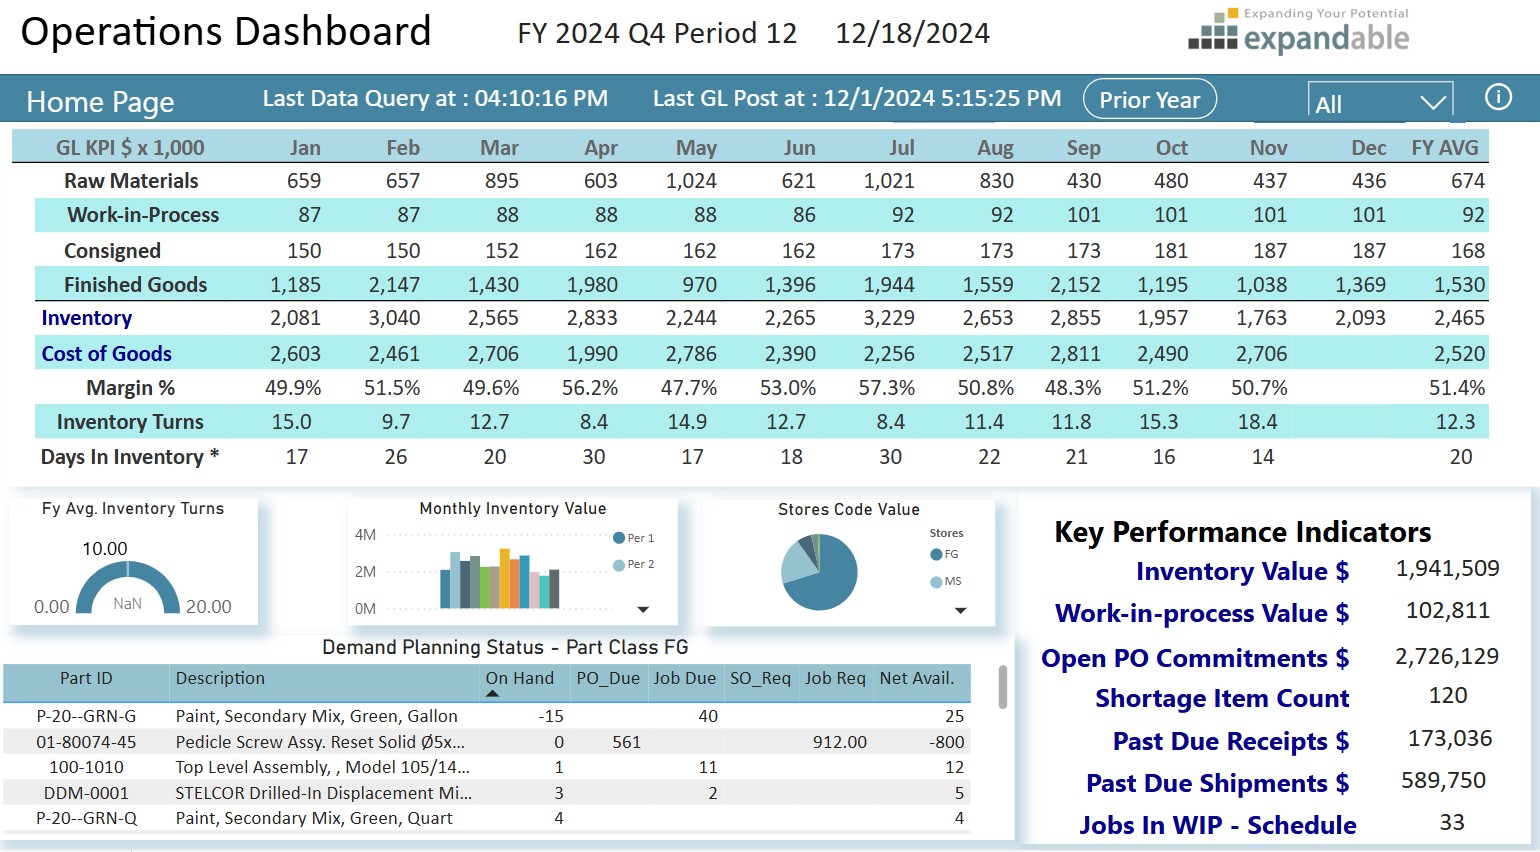
Expandable Software has three pre-built dashboards: Operations, Sales, and Finance. Users can begin using informative and interactive dashboards, with minimum training, upon deployment by using the included pre-built datasets. If additional dashboards are created and deployed, those dashboards will become instantly available to the users authorized to view those dashboards.
Data has to be Available in the System
A key criterion, however, is that the data you want to track has to be captured and exist in your system. You can’t report it if you don’t track it. This may mean using custom fields and input screens to collect the data you need.
Push Back from the User Community
There can be push back from the User Community whenever you create new metrics or reporting methods, particularly when some Users have been collecting and reporting data from offline sources or systems that they have been personally maintaining. In one large multi-billion multi-national Company, they had four separate User-generated systems reporting Bookings, Billings and Backlog, and all generated different answers, none of which matched Financial reporting. Eventually they were replaced with a single system that did match the Financials, but the hue and cry from the Users was significant when their personal systems were eliminated.
“Single Source of the Truth”
This is an absolute requirement and must be supported by Leadership. Without this, you get fractured and inconsistent data, which leads to innumerable problems and debates. If Leadership allows multiple sources of data, the credibility of all systems is questioned.
Data vs. Information
This is an important distinction that is often overlooked. Data is just that – DATA. Information is data that has been synthesized and analyzed to make it relevant to the User. Pages full of numbers are not particularly useful to Managers; more often or not it will just be discarded. Data that has been synthesized so a Manager has something tangible to act on IS useful. In one Company, a Manufacturing Manager described it this way: “Every quarter, Finance drops a phone book on my desk [reports full of data] and tells me I’m a butt. By the time I get through it all, the next quarter is over and I’m a butt again.”
What’s Next?
All of the individuals presenting their KPI’s shared one common comment: “This is just the beginning.” They all saw the need for ongoing development and continuous improvement. The most common direction is to incorporate AI to assist with the synthesis and analysis of data to be able to generate better predictive analysis of what might happen and recommend corrective action if needed.
KPI’s vs. KPD’s – Key Performance Drivers
In recent years, there has been discussion of something beyond KPI’s – Key Performance Drivers (KPD’s).
Key Performance Drivers or KPD Metrics are an important concept for improving operational performance and hence business results. A KPD is a measure that directly affects a business outcome or achievement of a KPI. [1]
KPD Metrics can be:
- A leading indicator or early warning that a situation exists that if not addressed will lead to a poor result, such as Customer Satisfaction as a leading indicator of Customer retention.
- A performance metric that is associated with a preceding step in a value stream or business process, such as Lead Time as a driver for On-Time-In-Full Shipments KPI.
- A metric that contributes directly to a KPI and may be a component in the way a KPI is calculated such as Unit Sales, Average Selling Price and Direct Cost supporting a Gross Margin KPI.
In the simplest terms, a KPD is the action that makes the KPI move in a positive or negative direction. If “Speed” is your KPI for driving, the KPD’s are pressure on the accelerator to go faster, pressure on the brake to slow down.
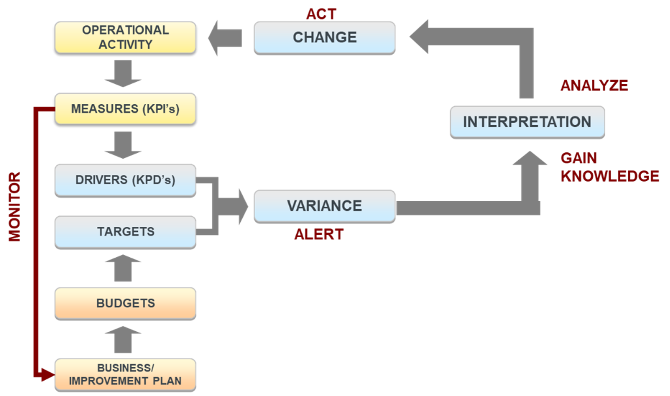
KPD metrics can be used as a part of a closed loop continuous improvement model
- Monitoring measures drivers against targets, goals and best practices, identifying issues, understanding the nature of the issues and ultimately identifying corrective action as needed.
KPD metrics must be actionable to positively impact business outcomes
- Measured against a goal or best practice
- Monitored frequently so issues can be identified and corrected quickly
- Assigned to an Owner who is responsible for results AND has the authority to take action
A Closed Loop Model Using KPD’s
Thanks and credit to all our Sip Club Participants and Presenters — Clay Tallon, Sean Duffy, Jonathan Nordquist, Michael David, and Bill Haynes — for their contributions and insights for the Sip Club.
Sip Club is a monthly, online knowledge-sharing event sponsored by Mirador Software Group and its subsidiary Companies. It’s designed primarily for our Customers – Manufacturing Professionals in Operations, Finance, and IT roles. Each session offers a safe space for our community to learn from one another, exchange ideas, and gain fresh perspectives from industry leaders.
Jeff Osorio is a Consulting CFO with over 40 years of experience in operationally oriented companies
ranging from pre-Revenue to $4B with over 40 ERP implementations in his portfolio. He is also an Adjunct Professor in the MBA program of the Leavey School of Business at Santa Clara University. https://www.linkedin.com/in/jeff-osorio-1412181/